HUD dashboard
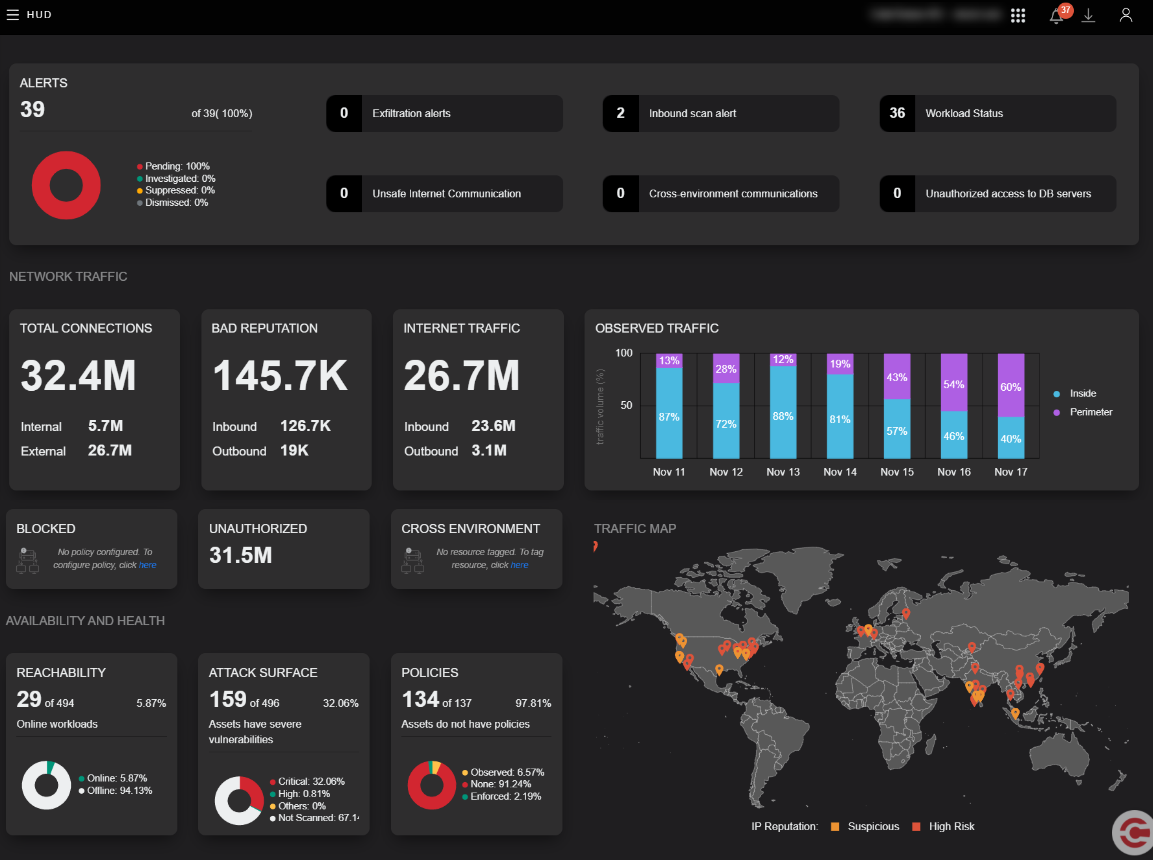
The HUD Dashboard is a single pane of glass to view all the critical events and your network's security and connectivity metrics. The widgets on the HUD Dashboard help SOC and NOC administrators and analysts remediate threats and improve the security posture of the network.
Data on the dashboard
-
Data sources - the data displayed on the dashboard is pooled from the Alerts engine, Flow Explorer, Policy engine, Threat intelligence engine, and the Nessus scan results.
-
Data filters - the data displayed on the dashboard is for the last 7 days, except for alerts that are for the last 30 days.
-
Data refresh intervals - data is refreshed in real-time, except for network traffic widgets which lag by 30 minutes.

You may need to activate some settings and features to see data for some widgets. These settings are not enabled by design. For example, to see data in the ATTACK SURFACE widget, you must activate and run one of the vulnerability scanners (Nessus or ColorTokens).
Continue reading to see the details of the data displayed in the widgets and the pre-conditions to see the data.
Widgets on the dashboard
The widgets are grouped and categorized by the area of interest for the SOC and NOC personnel - alerts, network traffic, availability and health, and geo-locations of threat-reputed traffic.
Alerts
The Alerts widgets display data for the last 30 days.
Enable relevant alerts on the Settings > Alert Config page to see data in the Alerts widgets.
-
Total number and percentage of alerts by their status - Pending, Investigated, Dismissed, and Suppressed
-
Workload status - the total number of alerts generated when workloads went to the 'Suspended' state and got back to the 'Reachable' state
-
Exfiltration - generated when the rolling average of data transferred over successive windows of 6 hours over a period of 7 days, from an asset to a public entity is more than 10 MB or twice the last rolling average
-
Inbound Scan - generated when a workload receives Five or more inbound connection requests on the blocked ports in the last one hour
-
Unsafe Internet communication - the total number of alerts generated when assets in the Xshield-protected network communicated with entities on the Internet that pose a high threat (as determined by the threat intelligence engine)
-
Cross-environment communication - the total number of alerts generated for communication between assets tagged with different 'ENVIRONMENT' tags. For example, assetA in the 'Production' environment communicates with assetB in the 'UAT' environment.
-
Unauthorized access to DB servers - the total number of alerts generated when attempts were made to connect to workloads that are tagged with the 'DB' (database) role
To know more on Alerts, see Alerts reported in Xshield.
|
|

|
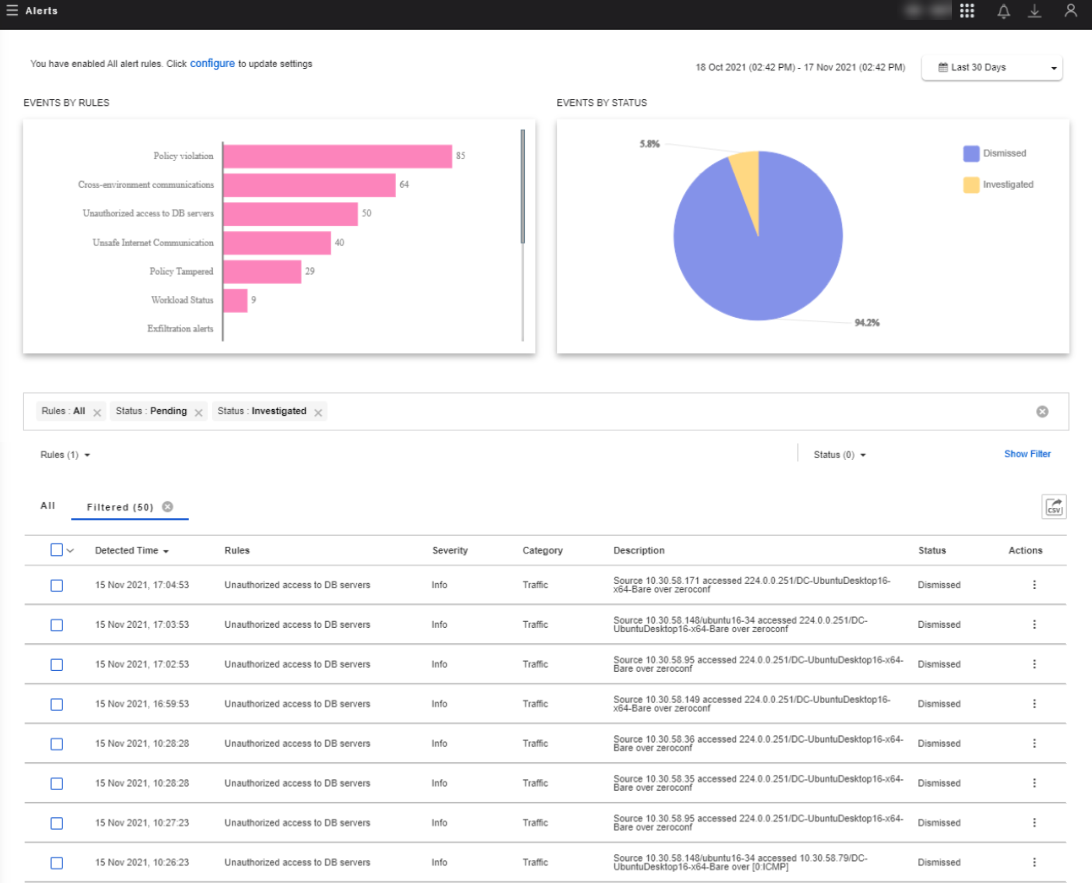
All the Six widgets for the individual types of alerts are interactive. Click a widget to see the filtered view of the Network Alerts page by the type of alert.
The following example screenshot shows the Network Alerts page filtered by the 'Unauthorized access to DB servers' alerts when the Unauthorized access to DB servers widget is clicked.

Network Traffic
The Network Traffic widgets display data for the last 7 days and lag by 30 minutes.
-
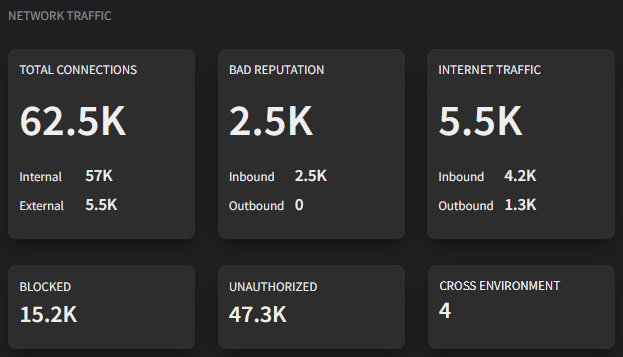
TOTAL CONNECTIONS - the total number of network connections in the Xshield-protected network
-
BAD REPUTATION - the number of connections made to entities that the threat intelligence engine categorized as a high risk of threats
-
INTERNET TRAFFIC - the number of inbound and outbound connections with the Internet
-
BLOCKED - the number of policy-violating connections to the Enforced assets that were blocked/denied
Enforce policies on Workload groups ( Workload groups page) to see data.
-
UNAUTHORIZED - the number of policy-violating connections to the Observed assets
Assign policies on Workload groups ( Workload groups page) to see data.
-
CROSS-ENVIRONMENT - the number of connections across environments
Tag assets with the ENVIRONMENT tag ( Assets page) to see data.
|

|
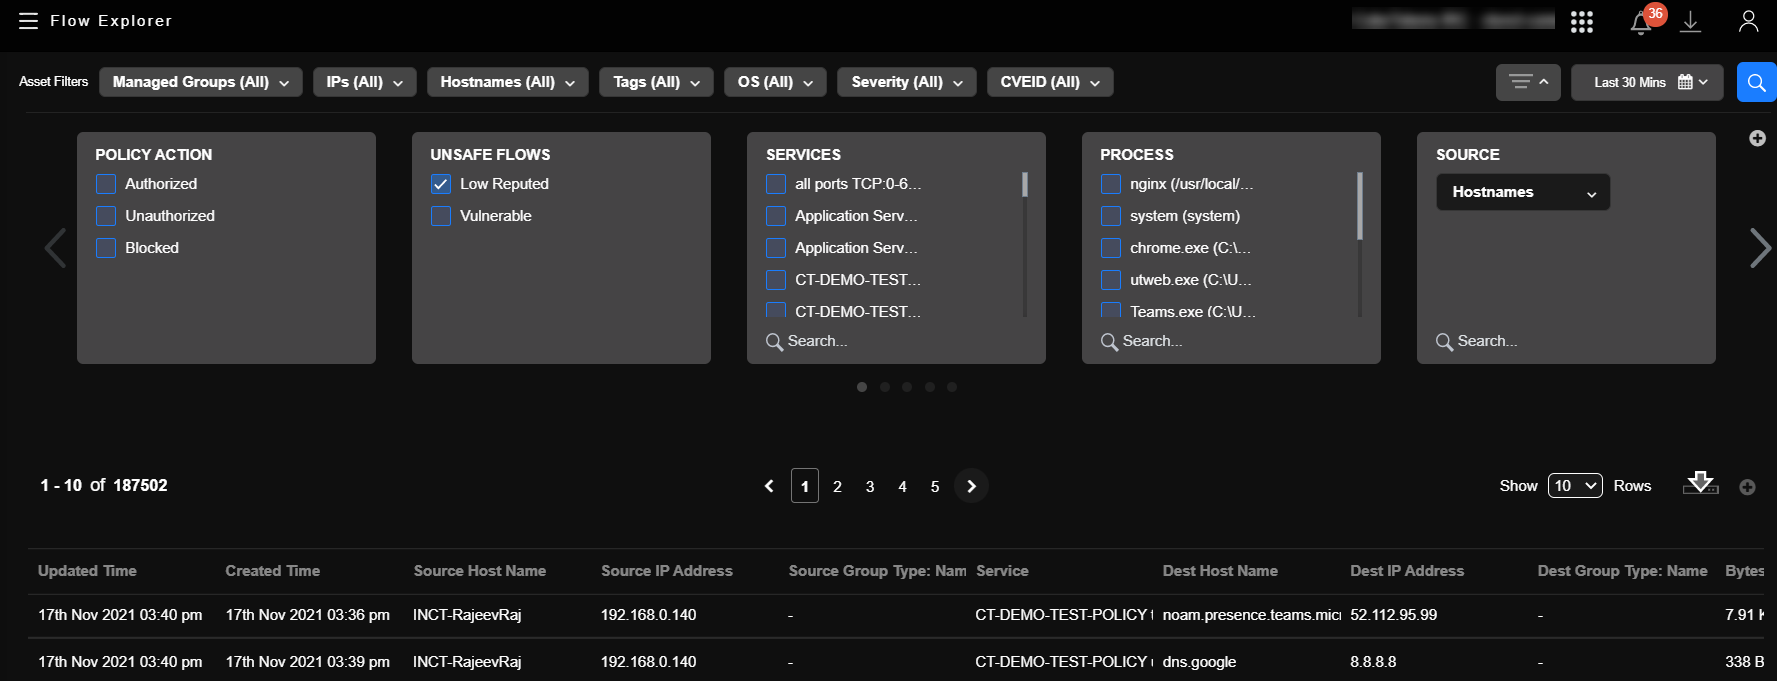
The BAD REPUTATION, BLOCKED, and UNAUTHORIZED widgets are interactive. Click a widget to see the filtered view of the Flow Explorer page by the type of flow. The BAD REPUTATION widget filters the flows by UNSAFE FLOWS = Low Reputed on Flow Explorer, the BLOCKED widget by POLICY ACTION = Blocked, and the UNAUTHORIZED widget by POLICY ACTION = Unauthorized.
The following example screenshot shows the Flow Explorer page filtered by 'Low Reputed' flows.

Availability and Health
The Availability and Health widgets are updated in real-time.
-
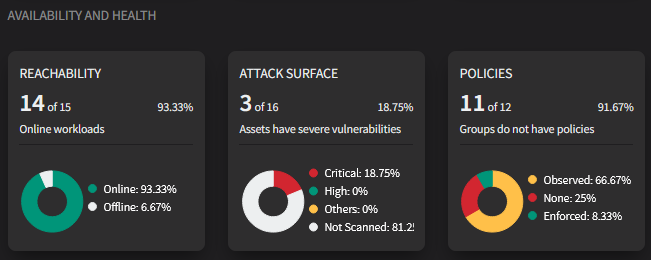
REACHABILITY - the total number and percentage of workloads by their reachability status - Online (Reachable) and Offline (Unreachable or Suspended)
-
ATTACK SURFACE - the total number and percentage of workloads by the CVSS score of the highest vulnerability on the workload - Critical (9-10), High (5-8.9), Others (0 to 4.9), and Not scanned
Activate and run one of Nessus or ColorTokens vulnerability scanners ( Settings > Tools > Risk Assessment Tools page) to see data.
-
POLICIES - the number and percentage of Workload groups by their policy enforcement status - None (policies are not assigned), Observed and Enforced
|

|
Observed Traffic
The Observed Traffic widget display data for the last 7 days and lag by 30 minutes.
-
The percentage volume of traffic by Inside (within assets in the Xshield-protected network) and Perimeter (to and from the Internet)
-
Hover over a segment of a bar to see the total number of network sessions and the data throughput
|

|
Traffic Map
The Traffic Map widget displays data in real-time.
-
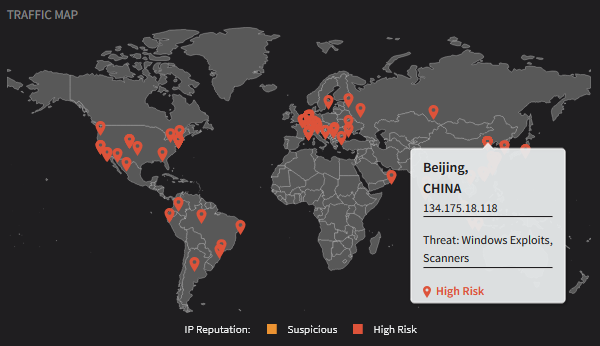
A geo-location heat map with location markers for the last 100 'Suspicious' and 'High Risk' connections
-
Hover over a location marker to see the origin of the threat, the IP address, and the type of threats expected (as determined by the threat intelligence engine)
|

|
